
Key takeaways
- Screen fast: five numbers tell you whether a deal could work.
- NOI excludes your mortgage; cap rate compares buildings; cash-on-cash and DSCR test your financing.
- Build your own expenses and verify rents instead of trusting the seller’s summary.
- Stress test every deal: higher expenses, lower rents and a longer vacancy.
You do not need a finance degree to screen a multifamily deal. You need five numbers, a few honest assumptions and a routine you can repeat. Here is the 15-minute version, with a worked example you can copy.
In this article
- Why a fast first pass matters
- Five numbers to know
- The 15-minute process
- A worked example
- Where first-pass numbers go wrong
- Three more quick metrics
- Tools that speed it up
- Where to get numbers you can trust
- A one-page deal summary you can reuse
- Build the expense side line by line
- Stress test the result
- Where real upside comes from (and what not to count)
- Red flags in a seller’s package
- Comparing two deals side by side
- How financing terms change the answer
- Frequently asked questions
Why a fast first pass matters
If you wait for a perfect set of numbers on every listing you will miss good deals and waste time on bad ones. A 15-minute screen lets you reject most properties quickly and spend real effort on the few that deserve it. The goal is not precision. The goal is to find out whether a deal could work.
Five numbers to know
- Gross potential rent (GPR): every unit at market rent, all year.
- Effective gross income (EGI): GPR minus vacancy and credit loss.
- Net operating income (NOI): EGI minus operating expenses. It does not include your mortgage payment.
- Cap rate: NOI divided by purchase price. It lets you compare buildings regardless of financing.
- Cash-on-cash return: annual cash flow after debt service divided by the cash you invested.
Lenders also look at the debt service coverage ratio (DSCR): NOI divided by annual debt service. A ratio above 1.0 means the property covers its payment, and many commercial lenders want 1.20 to 1.25 or more, so treat anything lower as a warning.
- NOI
- Effective gross income − operating expenses
- Cap rate
- NOI ÷ purchase price
- DSCR
- NOI ÷ annual debt service
- Cash-on-cash
- Annual cash flow ÷ cash invested
The 15-minute process
- Get the rent roll and trailing expenses. Ask for the last 12 months of income and expenses, not just the broker’s summary.
- Verify rents. Compare the rent roll with leases and recent bank deposits where you can.
- Apply realistic vacancy. Use what the market and the building actually experience, not zero.
- Build your own expenses. Taxes, insurance, utilities you pay, repairs, management (even if you self-manage), payroll and reserves.
- Calculate NOI and cap rate.
- Test the financing. Plug in your loan or seller-finance terms and check DSCR and cash-on-cash.
- Stress test it. Raise expenses 10% and push vacancy to 10%. If it still works, keep going.
A worked example
An 8-unit building is listed for $640,000. Each unit rents for $950 a month.
| Line | Annual amount |
|---|---|
| Gross potential rent (8 x $950 x 12) | $91,200 |
| Vacancy and credit loss (5%) | −$4,560 |
| Effective gross income | $86,640 |
| Operating expenses (45% of EGI) | −$38,988 |
| Net operating income | $47,652 |
| Cap rate ($47,652 / $640,000) | 7.45% |
Now add financing. Suppose a 75% loan ($480,000) at 6.5% over 25 years, which is about $38,900 a year in payments. Cash flow after debt service is roughly $8,800. If you put in $192,800 in total ($160,000 down, which is 25%, plus $32,800 for closing costs, repairs and reserves), cash-on-cash return is about 4.5% and DSCR is about 1.23.
Notice two things. A 1.23 DSCR is close to many lenders’ minimums. And the 4.5% cash-on-cash return is below the 7.45% cap rate, which means the loan is costing more than the property earns on the money borrowed (negative leverage). On these terms the deal needs a lower price, better financing or real upside to be worth doing, and you learned that in minutes. Raise the rents, negotiate the price or change the terms and watch how the answer moves. Illustrative numbers only.
Where first-pass numbers go wrong
- Using the seller’s expense number. Many summaries leave out management, reserves or true repair costs.
- Forgetting the units you pay utilities for. Water, sewer and common-area electric add up.
- Assuming rents will rise on day one. Raising rents depends on leases, notice rules and your market.
- Ignoring capital expenses. Roofs, boilers and parking lots do not show up in NOI.
- Skipping the stress test. A deal that only works at perfect occupancy is not a good deal.
Three more quick metrics
- Price per unit: $640,000 ÷ 8 units = $80,000 per unit. Compare it with recent sales of similar buildings.
- Gross rent multiplier (GRM): price ÷ annual gross rent = $640,000 ÷ $91,200, about 7.0. A rough way to rank deals, but it ignores expenses.
- Break-even occupancy: (operating expenses + debt service) ÷ gross potential rent = ($38,988 + $38,892) ÷ $91,200, about 85%. The lower it is, the more cushion you have.
Tools that speed it up
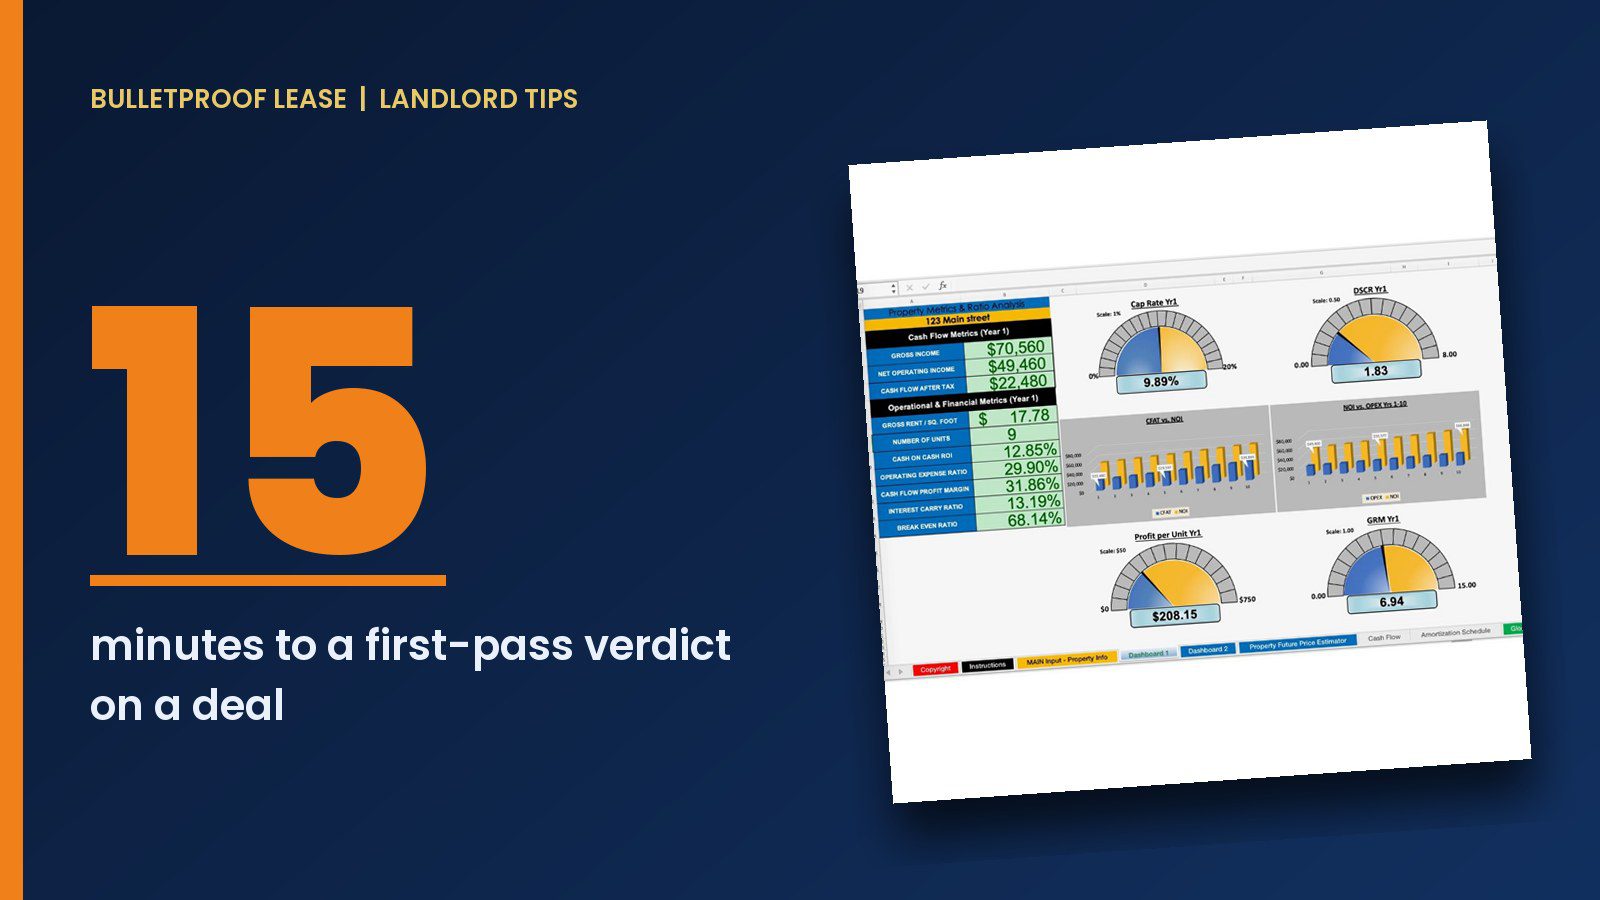
A spreadsheet that does the math for you turns this into a repeatable routine. The Multifamily Investment Analyzer calculates cash flow, ROI and cap rate with 30-year projections and loan amortization, in Excel or Google Sheets. For a quick go or no-go on a rental or flip, the 2 Minute Offer Tool is built for speed. If you are comparing financing options as well, read how investors buy multi-family without a bank.
Where to get numbers you can trust
- Rent roll: unit, tenant, rent, lease dates, deposits. Compare it with signed leases.
- Trailing 12-month income and expense statement: ask for bank deposits to back it up.
- Tax bills: check the assessment, and ask whether a sale could trigger a reassessment in your area.
- Insurance quote: get your own, not the seller’s old policy.
- Utility bills: twelve months of water, sewer, gas, electric and trash for anything the owner pays.
- Market rents: three or four comparable units, not the best listing.
- Repair history: invoices and permits for major systems.
A one-page deal summary you can reuse
Keep every deal in the same format so you can compare them side by side. A useful page includes:
- Address, unit mix and year built.
- Asking price, your offer and price per unit.
- Gross rent, vacancy, expenses, NOI and cap rate.
- Financing terms, annual debt service, DSCR and cash-on-cash.
- Cash needed at closing, including repairs and reserves.
- Biggest risks and what would change your mind.
- Your walk-away price.
A spreadsheet that does the arithmetic makes the routine fast. The Multifamily Investment Analyzer is built for it, and our guide to seller financing shows how terms change the result.
Build the expense side line by line
Most bad deals hide in the expense column. Instead of a single percentage, price each line. For the 8-unit example, here is one way the 45% operating-expense figure might break down:
| Expense | Annual | How to estimate it |
|---|---|---|
| Property taxes | $9,000 | Latest bill, adjusted for any reassessment |
| Insurance | $4,200 | Your own quote |
| Water and sewer | $4,800 | Twelve months of bills |
| Common-area utilities | $2,000 | Twelve months of bills |
| Repairs and maintenance | $6,400 | About $800 per unit, then adjust for age |
| Management | $6,931 | About 8% of income, even if you self-manage |
| Trash, snow and lawn | $2,000 | Vendor quotes |
| Legal, accounting, supplies | $1,200 | Past statements |
| Reserves | $2,457 | A placeholder; set your own figure from the building’s age and condition |
| Total | $38,988 | 45% of effective income |
Illustrative figures; replace each line with real quotes and bills.
Stress test the result
A deal that only works if everything goes right is a gamble. Re-run the example with three bad scenarios:
| Scenario | NOI | DSCR | Cash flow after debt |
|---|---|---|---|
| Base case | $47,652 | 1.23 | about $8,800 |
| Expenses up 10% | $43,753 | 1.12 | about $4,900 |
| Vacancy at 10% | $43,092 | 1.11 | about $4,200 |
| Both at once | $39,193 | 1.01 | about $300 |
In the worst case the building still covers its debt, but with a 1.01 coverage ratio it would not qualify for most commercial loans, which often want 1.20 or better, and one more surprise puts it underwater. That tells you how much cushion you have, and whether you need a lower price, better terms or bigger reserves to sleep at night.
Where real upside comes from (and what not to count)
- Rents that are below market. Lawful increases as leases renew, within local rules and notice periods.
- Expense control. Shopping insurance, billing back utilities where allowed, separate meters, better vendors.
- Lower vacancy. Faster turns, better screening and sensible pricing.
- New income. Laundry, storage or parking, where they are legal and practical.
Be careful about paying the seller for upside you have not earned yet. Underwrite today’s income and treat improvements as your reward for doing the work, not as a promise the seller made.
Red flags in a seller’s package
- A rent roll that is round and perfect, with no vacancies and no turnover.
- Expenses that leave out management, reserves or repairs.
- Rents the seller “could” get but is not collecting.
- Unwillingness to share bank deposits, tax returns or utility bills.
- Tenants who are reluctant to talk or leases that do not match the rent roll.
- Unpermitted units or work that will not pass an inspection.
When you spot one, ask a calm question and see how the seller responds. Often the answer tells you more than the number does.
Comparing two deals side by side
Suppose you have two buildings in front of you. Deal A is the 8-unit property from the example above. Deal B is another 8-unit building listed at $520,000 with rents of $850 and higher expenses at 48% of income.
| Measure | Deal A | Deal B |
|---|---|---|
| Price | $640,000 | $520,000 |
| Net operating income | $47,652 | $40,310 |
| Cap rate | 7.45% | 7.75% |
| Cash invested (75% loan at 6.5%, 25 years, plus costs and reserves) | $192,800 ($160,000 down + $32,800 costs) | $160,400 ($130,000 down + $30,400 costs) |
| Annual debt service | $38,892 | $31,600 |
| Cash flow after debt | $8,760 | $8,711 |
| Cash-on-cash return | 4.5% | 5.4% |
| DSCR | 1.23 | 1.28 |
Deal B needs less cash and returns more on it, with similar cash flow. But the numbers do not tell you which building has the newer roof, the better tenants or the safer neighborhood. Use them to narrow the field, then let inspections, tenant quality and your plan break the tie. Illustrative numbers only.
How financing terms change the answer
- Rate: a one-point change in the rate moves the payment and the DSCR noticeably on a building this size.
- Amortization: a longer schedule lowers the payment but builds equity more slowly.
- Interest-only periods: lower payments now, but the balance does not fall.
- Fixed versus variable: a variable rate can rise, so stress test your payment.
- Prepayment penalties and fees: they change the true cost if you refinance or sell early.
- Loan-to-value: a lower percentage means more cash up front and less risk.
Always run the deal with the real terms you expect to get, not the best case you saw advertised. For more ways to structure acquisitions, see how investors buy multi-family without a bank.
Frequently asked questions
What is a good cap rate?
There is no universal number. It depends on the market, the building, the condition and the risk you take. Compare similar properties in the same area rather than chasing a single target.
Should I count management if I self-manage?
Yes. Include a management line so the deal still works if you hire someone later, and so your time has a price.
How much should I budget for expenses?
Use the building’s actual trailing 12 months as a starting point, then adjust for taxes that may reset, insurance quotes and repairs. A flat percentage of income is only a placeholder.
What if the numbers do not work?
Change a variable and see what it takes: a lower price, better terms, higher rents or lower costs. If nothing realistic works, move on.
Run a quick first pass on the next listing
The 2 Minute Offer Tool is built for fast go or no-go decisions on rentals and flips. When a deal survives the first pass, build the full picture in the Multifamily Investment Analyzer.
This article is general education, not legal, tax, financial or investment advice, and it does not promise any result. Laws and lending rules differ by state and city, and numbers in examples are illustrative. Talk to your own attorney, accountant and lender before you act.

Keep reading
Seller Financing for Rental Property: Terms to Negotiate
How seller financing works, why sellers agree, the terms to negotiate, the paperwork to insist on and the risks to…
How to Estimate Rehab Costs Before You Buy a Rental or Flip
A repeatable walkthrough, a line-item budget, three bids, a contingency and a way to track actuals, so rehab costs stop…