
Key takeaways
- The 70% rule screens a flip: maximum offer = (ARV × 70%) − repairs.
- Support your ARV with three solid comparable sales, not hopeful listings.
- Closing, interest, holding, selling costs and a contingency decide the real margin.
- Write down a walk-away number before you negotiate and track the flip against it.
Flippers do not lose money on the houses they hate. They lose money on the ones that looked great on a napkin. Here is the 70% rule, how to get the after-repair value right and the full math that tells you whether a flip is worth doing.
In this article
- The 70% rule, in plain English
- Get ARV right first
- The costs that quietly kill margin
- A full-math example
- Know your walk-away number
- Track the flip from purchase to sale
- When a flip should become a rental
- How to estimate holding costs
- Price the exit before you buy
- Red flags that kill flip deals
- How to pull ARV comps, step by step
- Financing costs: hard money, points and draws
- A realistic flip timeline
- Mistakes that cost first-time flippers money
- The same house at four purchase prices
- Selling: the part many first-timers underestimate
- Frequently asked questions
The 70% rule, in plain English
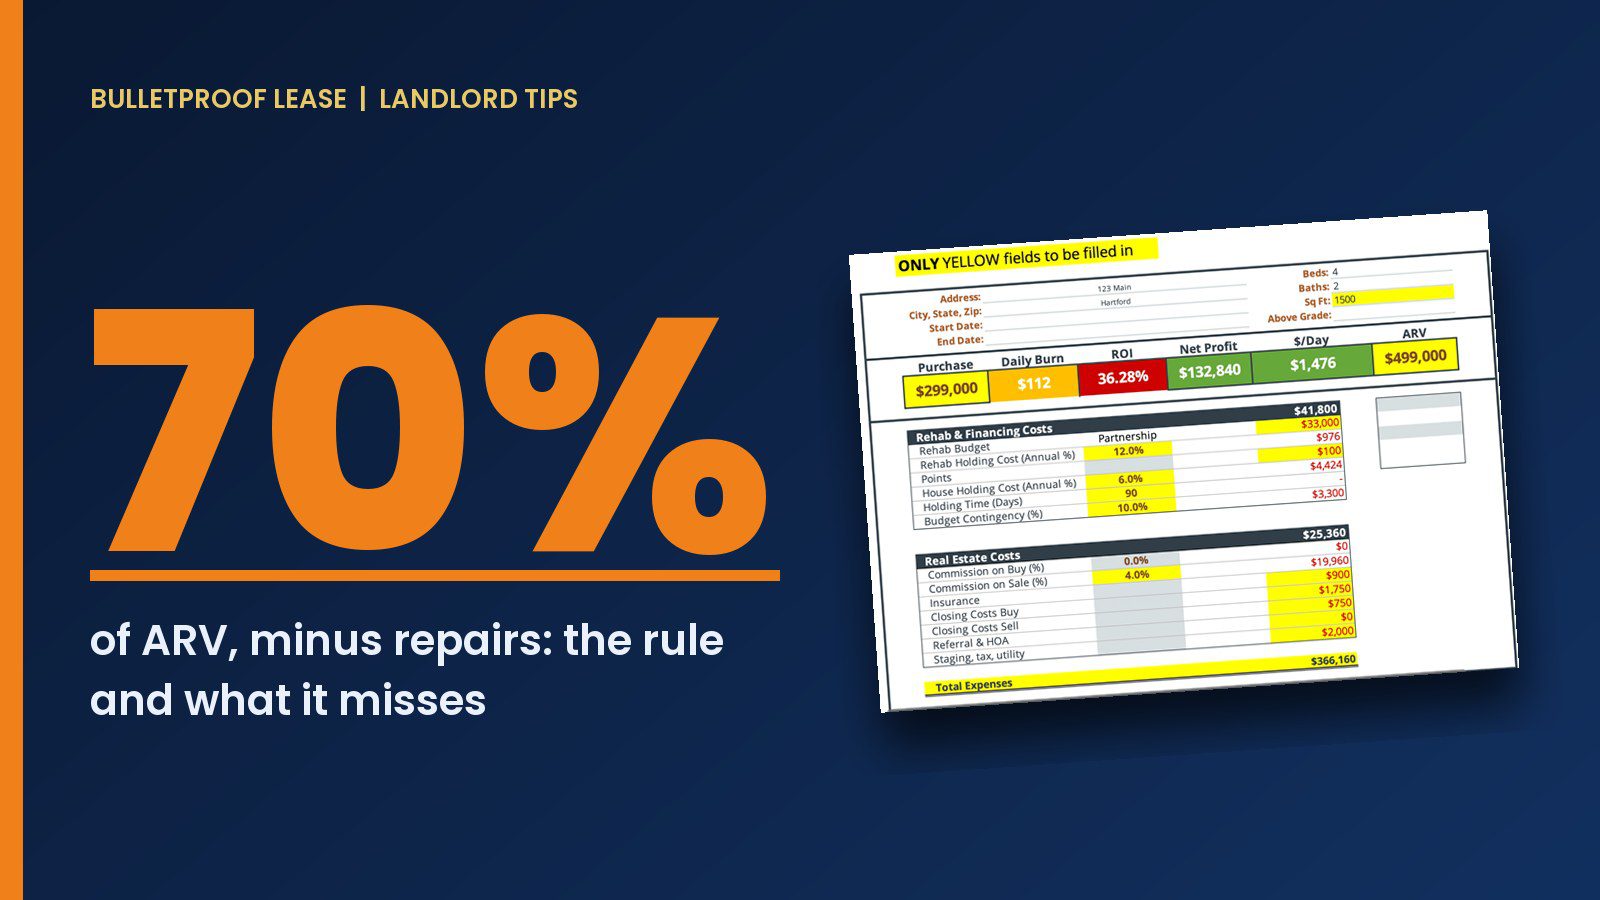
The 70% rule is a rule of thumb: a flipper should pay no more than 70% of the after-repair value (ARV), minus repair costs. The cushion is meant to cover purchase and sale costs, holding costs and profit.
Maximum offer = (ARV × 70%) − repairs.
If a house will be worth $300,000 when finished and needs $40,000 of work, the maximum offer is ($300,000 × 0.70) − $40,000 = $170,000. It is a screen, not a promise. Hot markets can push investors above it and thin markets may demand less.
Get ARV right first
Everything depends on ARV. Use recent sales of similar, renovated homes close by, within a similar size and condition, and be skeptical of the best comp. Active listings tell you what sellers hope for, not what buyers pay. If you cannot support the ARV with three solid comparables, your whole offer is a guess.
- Max offer
- (ARV × 70%) − repairs
- Example
- ($300,000 × 0.70) − $40,000 = $170,000
- Then check
- Closing + interest + holding + selling + contingency
- Walk away
- Set the number before you talk to the seller
The costs that quietly kill margin
| Cost | Why it gets missed |
|---|---|
| Purchase closing costs | Lender fees, title, recording and transfer taxes add up |
| Loan interest and points | Short-term money is expensive; every extra month costs |
| Property taxes and insurance | You carry both until you sell |
| Utilities and upkeep | Power, water, lawn or snow, lockbox, cleaning |
| Selling costs | Agent commission, closing costs and staging |
| Contingency | Surprises are normal on older houses |
A full-math example
A house with an ARV of $300,000 and $40,000 of repairs passes the 70% screen at $170,000. Now test it with the real costs: say $8,000 of buying costs, $14,000 of interest and holding costs over six months, $20,000 of selling costs and a $4,000 contingency. Total cost is $170,000 + $40,000 + $8,000 + $14,000 + $20,000 + $4,000 = $256,000. At a $300,000 sale that leaves about $44,000 before taxes, and profit from flipping is generally taxed as ordinary income, so ask your accountant what you keep.
Change the schedule to nine months, or the repairs to $55,000, and watch the margin shrink. That sensitivity is exactly why you run the full numbers before you offer. Illustrative numbers only.
Know your walk-away number
Decide your maximum offer before you talk to the seller, write it down and stick to it. The most expensive flips are the ones where the buyer fell in love with the house and paid the last $10,000 out of margin. A clear walk-away number is also the easiest way to stay disciplined when a deal gets competitive.
Track the flip from purchase to sale
Once you own it, a simple tracker keeps everything in one place: purchase costs, budget versus actual, loan balance and interest, timeline and projected profit. The Basic House Flipping Spreadsheet does this, and the free flip analysis calculator gives you a quick estimate of net profit and return from your inputs. For the repair side of the numbers, start with our guide to estimating rehab costs.
When a flip should become a rental
Some deals work better as holds than as sales: a strong rent-to-value ratio, a neighborhood with steady demand, or a market where selling costs would eat the margin. If you might keep it, test the property against rental numbers as well, using the method in our deal analysis guide, before you buy.
How to estimate holding costs
Holding costs are the monthly cost of owning the house while you work on it and sell it. Add up:
- Loan interest (and any monthly fees).
- Property taxes and insurance, divided by twelve.
- Utilities, lawn or snow service and a lockbox or security.
- Any association or permit costs that recur.
As an example, interest-only payments on a $150,000 loan at 11% are about $1,375 a month. Add taxes, insurance and utilities and the total can easily exceed $2,000 a month. Six months of work and sale time is $12,000 or more, before a single repair is done, which is why the schedule matters as much as the budget.
Illustrative numbers only.
Price the exit before you buy
- Who is the buyer? A family using a mortgage, an investor or a cash buyer each shop differently.
- How long do comparable homes sit? Use the days on market for recently sold, renovated homes, not the asking price.
- What will inspections find? A clean inspection protects your closing date and your price.
- What is plan B? If the house does not sell at your target, can you rent it and hold? Run both sets of numbers up front.
Red flags that kill flip deals
- An ARV based on one or two lucky comps.
- A repair budget with no contingency.
- No written bids on the big items.
- A schedule with no buffer for permits and weather.
- Financing that comes due before the work can realistically finish.
How to pull ARV comps, step by step
- Set your search box. Start within half a mile (wider in rural areas) and sales from the last three to six months.
- Match the product. Similar style, age range, square footage (within roughly 20%), bedrooms, baths and lot.
- Use renovated sales. Only sold homes that were updated to the level you will deliver.
- Adjust for differences. Garage, basement, lot, condition and location on a busy street all change value.
- Drop the outliers. Ignore the highest and lowest sale if they are unusual.
- Check the days on market. A price reached after 120 days is not the same as one reached in a week.
| Comp | Sold | Size | Price | Per sq ft |
|---|---|---|---|---|
| A | 2 months ago | 1,420 sq ft | $298,000 | $210 |
| B | 4 months ago | 1,500 sq ft | $305,000 | $203 |
| C | 3 months ago | 1,380 sq ft | $294,000 | $213 |
The three renovated sales cluster around $295,000 to $305,000 and $203 to $213 a square foot. If the subject house has about 1,450 square feet, that supports a $300,000 ARV. Illustrative comps.
Financing costs: hard money, points and draws
Many flippers use short-term loans. Know what you are paying:
- Interest. Often interest-only, so the balance does not shrink. On a $150,000 loan at 11%, interest is about $1,375 a month, or about $8,250 over six months and $12,375 over nine.
- Points. Upfront fees charged as a percentage of the loan. Two points on $150,000 is $3,000.
- Draws and inspections. Renovation funds may be released in stages after inspection, which can slow the schedule.
- Extension fees. If you run past the loan term, the cost can jump.
Compare the full cost of money, not just the interest rate. A cheaper loan with a rigid schedule can cost more than a pricier one that fits your plan. Illustrative figures.
A realistic flip timeline
| Phase | Typical range |
|---|---|
| Offer to closing | 3 to 6 weeks |
| Scope, bids and permits | 2 to 4 weeks |
| Renovation | 6 to 12 weeks, longer for structural or permit-heavy jobs |
| Listing and marketing | 2 to 6 weeks |
| Contract to closing for the buyer | 4 to 6 weeks |
Added up, that is often four to eight months from first offer to cash in hand, and each month has a holding cost. Use your own market and your own past jobs, and keep a buffer.
Mistakes that cost first-time flippers money
- Paying for a renovation level the neighborhood will not reward.
- Starting the job before the permits are in hand.
- Leaving no money for the last 10% of the project, which is where the surprises show up.
- Letting contractors work without a written scope and payment schedule.
- Pricing the house for what you need instead of what the comps say.
- Ignoring the tax bill, since flip profit is generally taxed as ordinary income.
Track every cost from day one. The Basic House Flipping Spreadsheet keeps purchase costs, budget versus actual and projected profit in one place.
The same house at four purchase prices
Using the earlier example (ARV $300,000, repairs $40,000, buying costs $8,000, holding $14,000, selling $20,000, contingency $4,000), here is how the purchase price drives profit:
| Purchase price | Total cost | Profit before tax | Verdict |
|---|---|---|---|
| $150,000 | $236,000 | $64,000 | Strong margin |
| $170,000 (70% rule) | $256,000 | $44,000 | Good, with room for surprises |
| $190,000 | $276,000 | $24,000 | Thin; one overrun erases it |
| $210,000 | $296,000 | $4,000 | Not worth the risk |
Every extra $20,000 you pay comes roughly straight out of profit. In practice financing and closing costs rise with the price too, so the real margin at the higher prices is thinner than this table shows, and flip profit is generally taxed as ordinary income. That is why a firm walk-away number is the most valuable tool in the business. Illustrative numbers only.
Selling: the part many first-timers underestimate
- Pricing: price to the comps, not to your costs. A house priced above the market sits, and sitting costs money every week.
- Presentation: clean, neutral and well photographed. Fix visible defects before a buyer finds them.
- Inspection: expect the buyer’s inspector to find something. Having permits, receipts and a clean report ready helps.
- Disclosures: know what your state requires you to disclose about the property and the work you did.
- Closing costs and concessions: budget for agent fees, transfer taxes and a possible buyer concession.
- Timeline: a buyer using a mortgage may need several weeks to close, so plan your loan term accordingly.
Frequently asked questions
Is the 70% rule always right?
No. It is a rule of thumb. Hot markets may allow a higher percentage and slow markets may need a lower one. Always run the full numbers.
How do I find ARV?
Use recent sales of similar renovated homes nearby, adjusted for size and condition, and verify with at least three comparables.
What contingency is reasonable?
Many flippers keep 10 to 20 percent of the repair budget in reserve, more for older houses or incomplete inspections.
How long should I plan for?
Plan on a realistic schedule from your past jobs and add buffer. Every extra month adds interest, taxes, insurance and utilities.
Try the free flip analysis calculator
Plug in your purchase price, ARV, rehab, holding and selling costs and see an estimated profit in seconds. Then track the real job in the House Flipping Spreadsheet.
Open the free calculatorGet the House Flipping Spreadsheet: $29.95
This article is general education, not legal, tax, financial or investment advice, and it does not promise any result. Laws and lending rules differ by state and city, and numbers in examples are illustrative. Talk to your own attorney, accountant and lender before you act.